PRODUCTS
INDUSTRY SOLUTION 4.0
PRODUCTS
INDUSTRY SOLUTION 4.0
Efficiency management
ECN Automation develops projects for the efficient management of plant resources such as electrical energy, fuel consumption, utilities and productive assets.
Power Management
A Power Management system's main objective is to monitor the most important plant power consumers either areas, machinery or motors to register the information and get historical graphics, cost evaluations, production KPI’s in order to make decisions of cost savings goals.
At ECN Automation we focus on offering solutions that help our clients make the best decisions. The steps for designing such a system are as follows:
Architecture
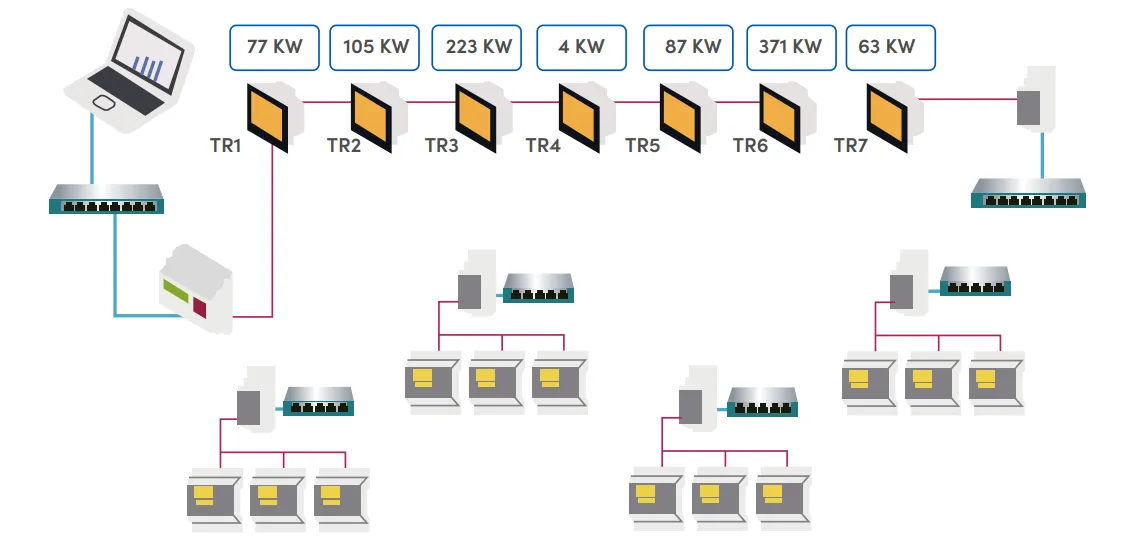
The elements of a traditional system are:
With our value solution, we guarantee a modular architecture that adapts to the requirements of the plant, with the necessary elements for gathering information and different communication protocols according to plant standards and electrical regulations.
Different architectures of Power Management System
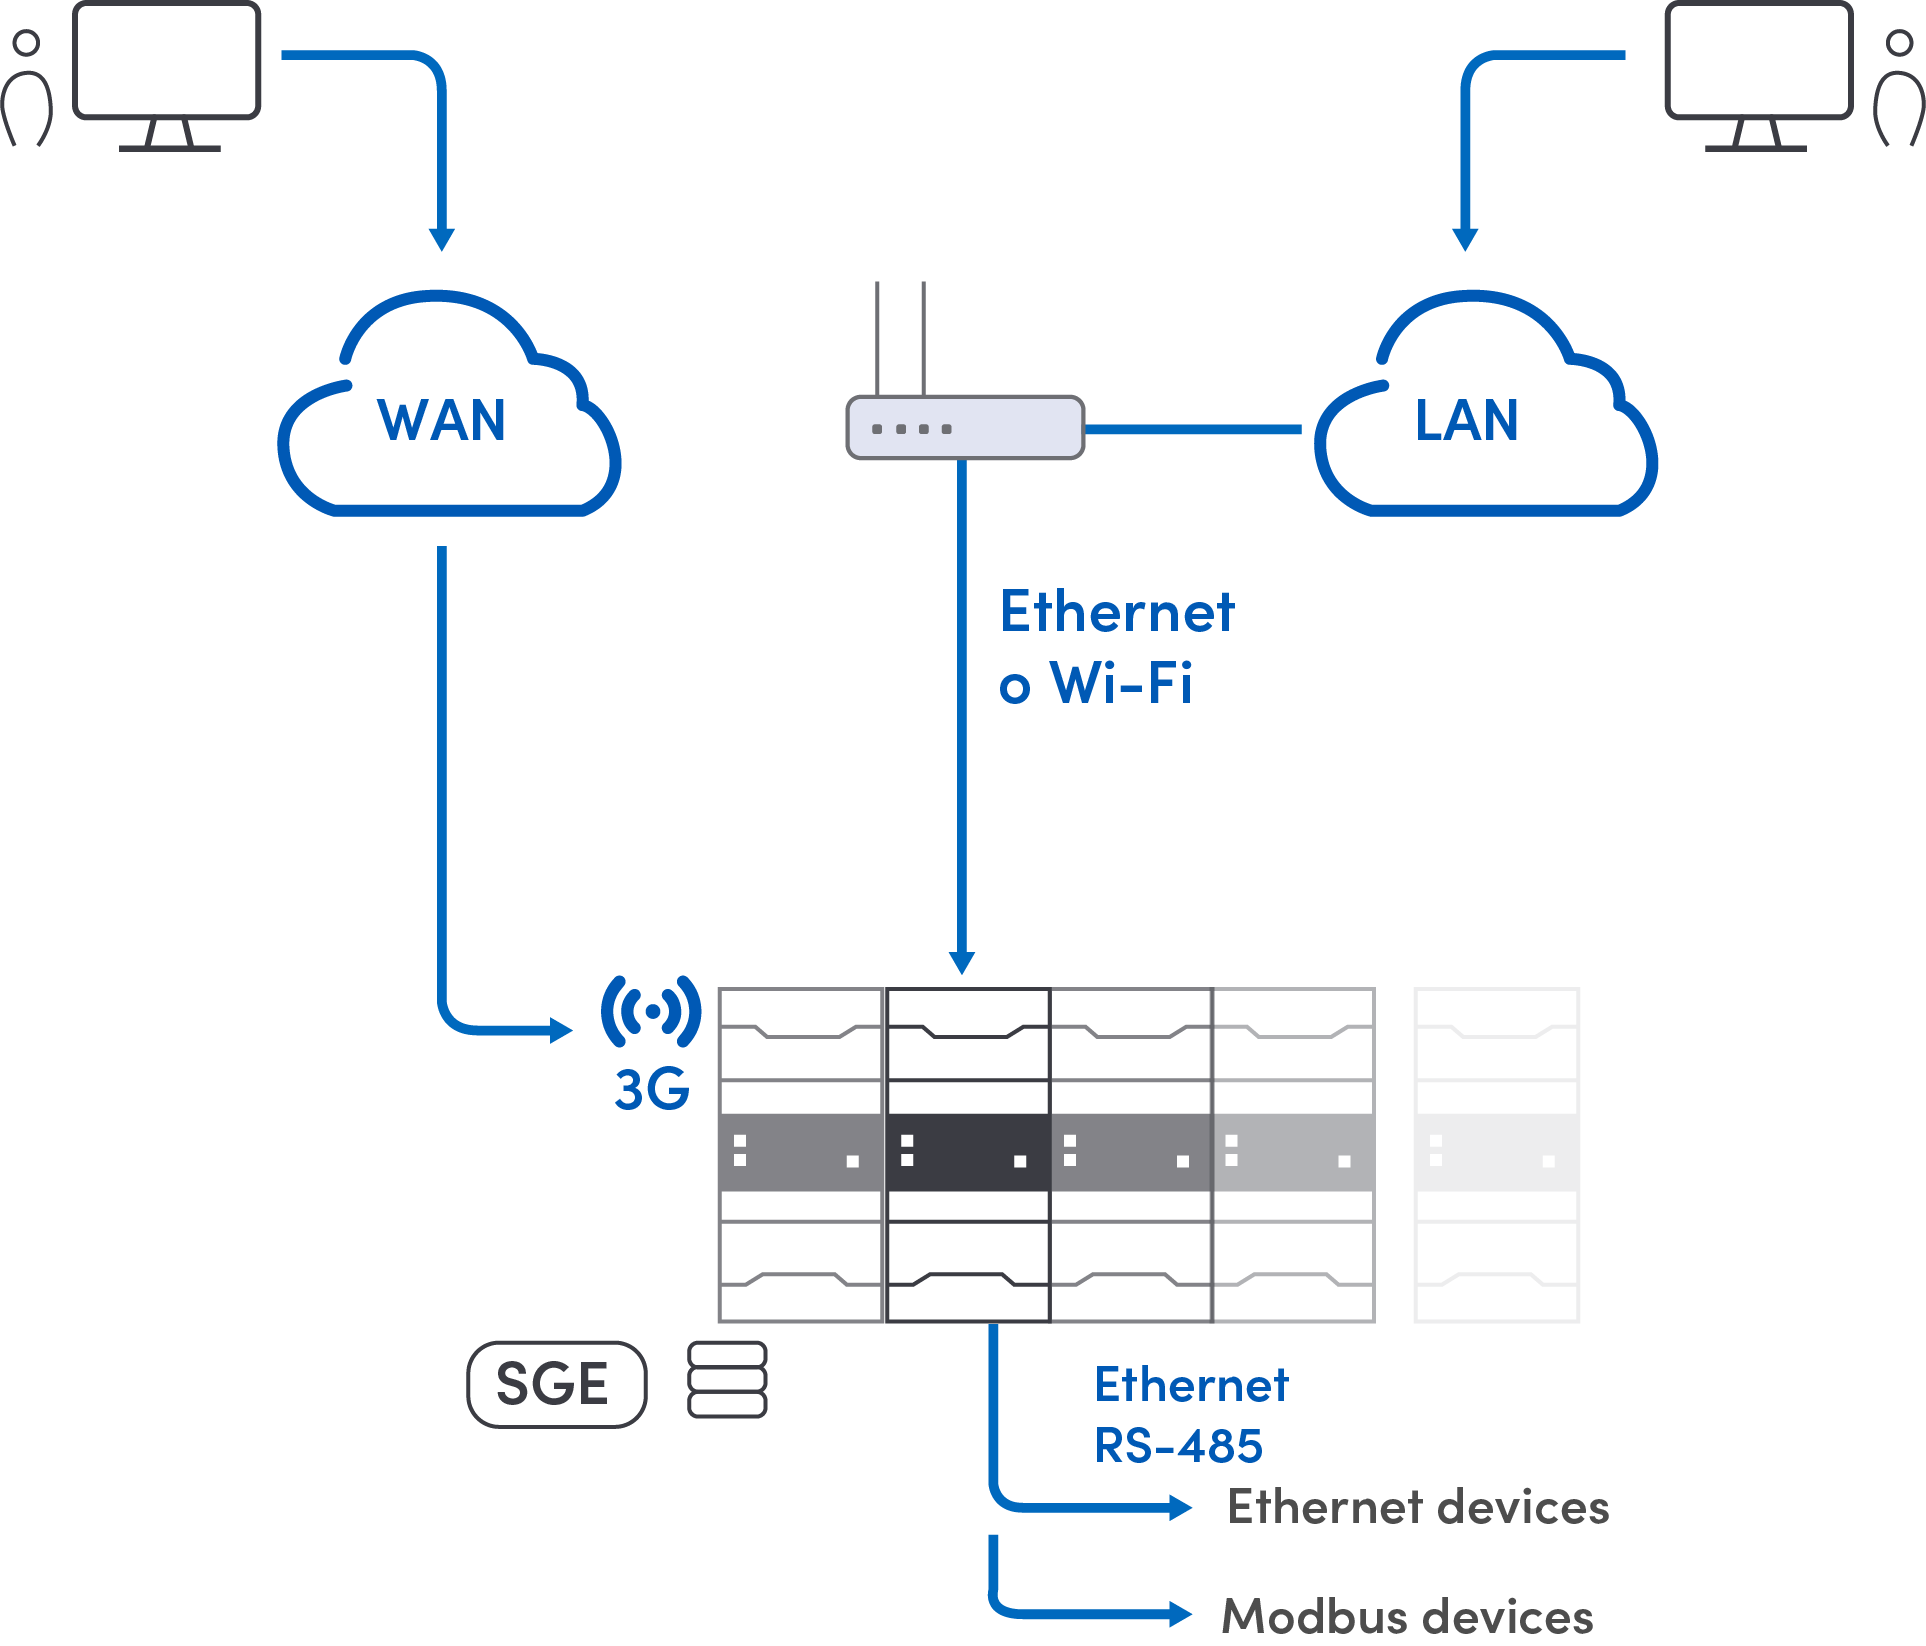
Architecture for data visualization in the cloud:
It allows you to send data directly to the cloud, registering and integrating it in the main current BigData platforms to be able to carry out an easy management through simple Dashboards, directly from the internet.
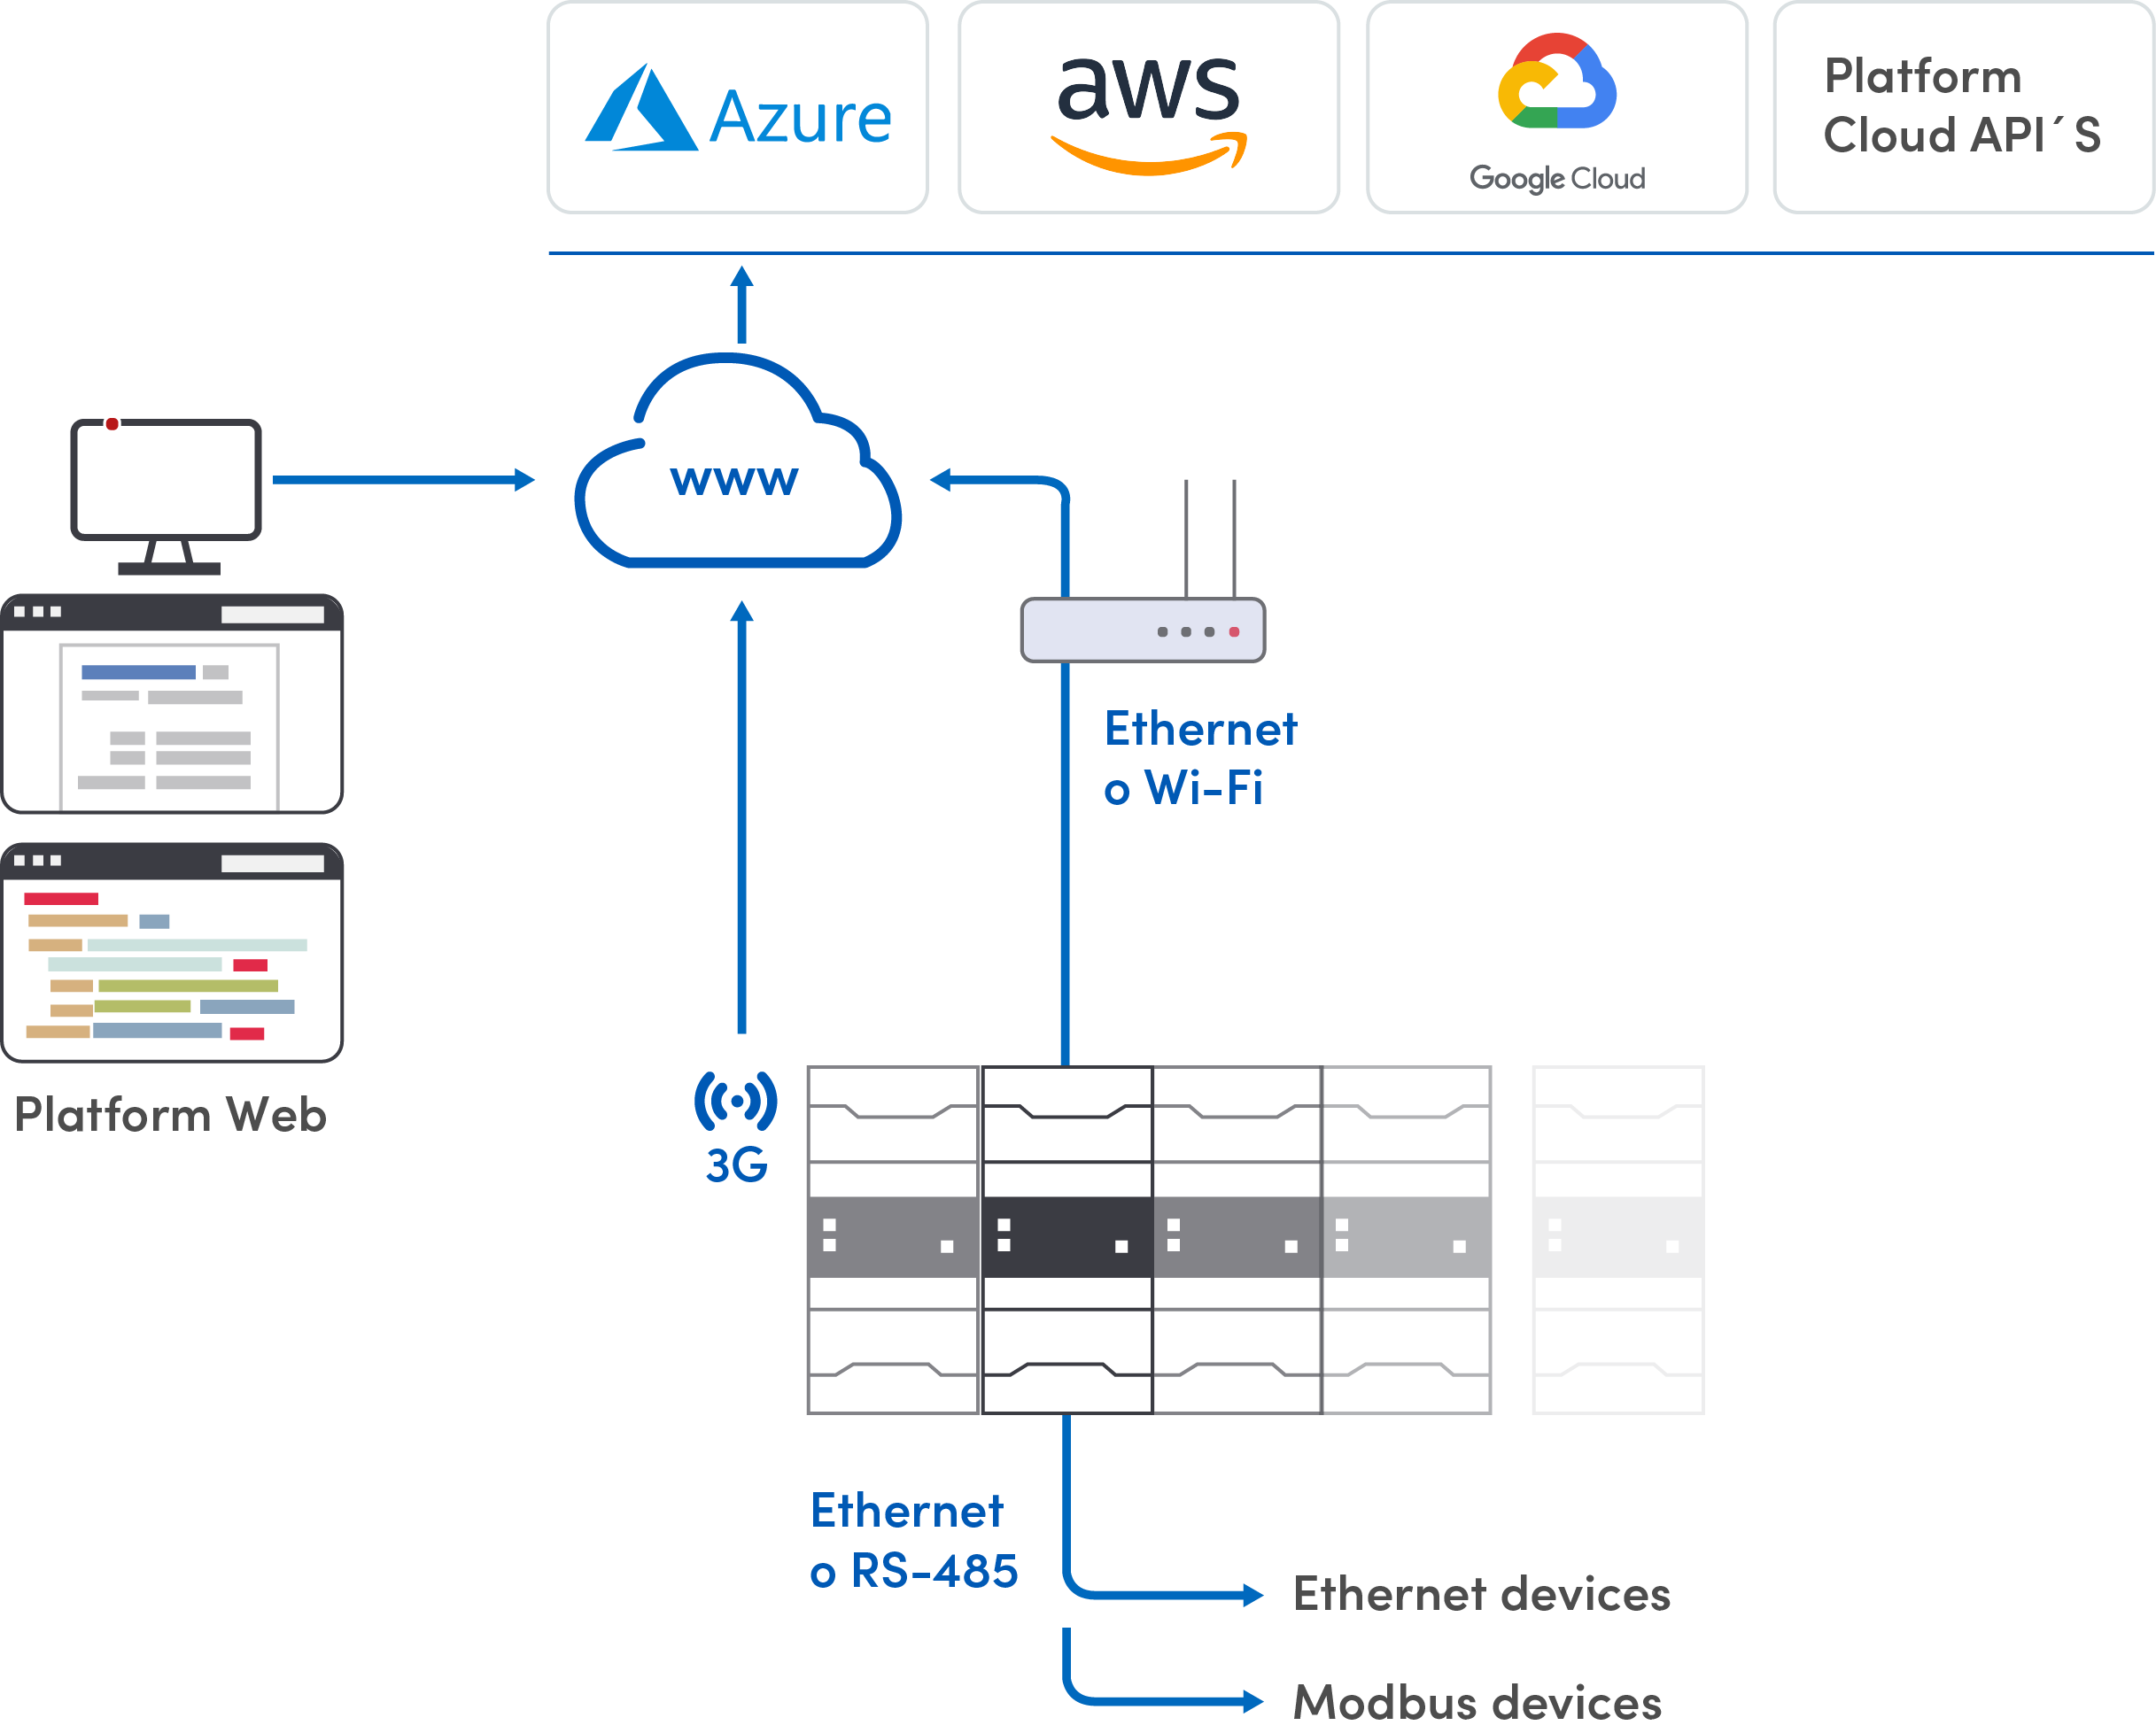
Architecture for data visualization in the cloud
System characteristics:
Examples of reports on different platforms
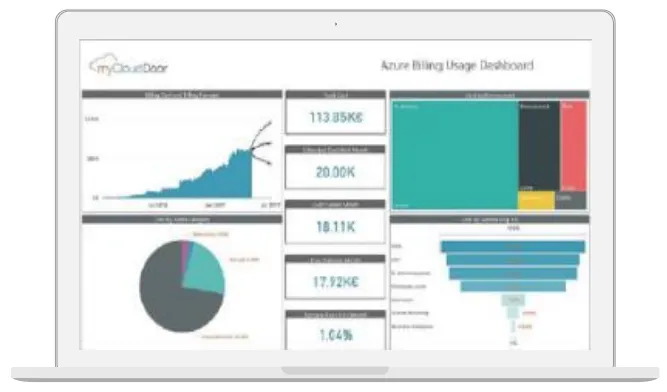
Azure platform
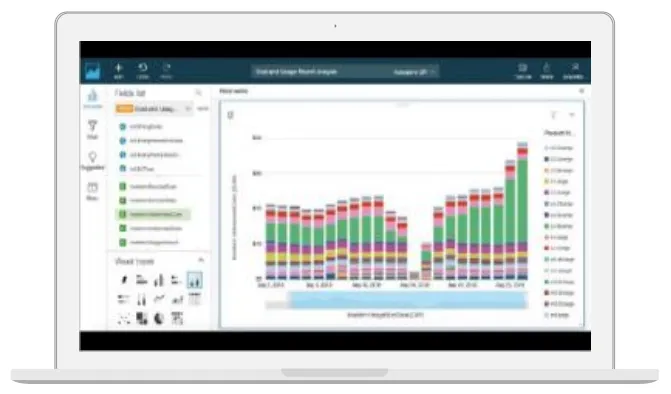
Azure platform
Architecture for local server display
A local system is developed with the Power Management software from any point within the plant where there is a Wi-Fi connection and from the consumption and quality monitoring computers.
Architecture for local server display
System characteristics:
Examples of screens and reports in local software
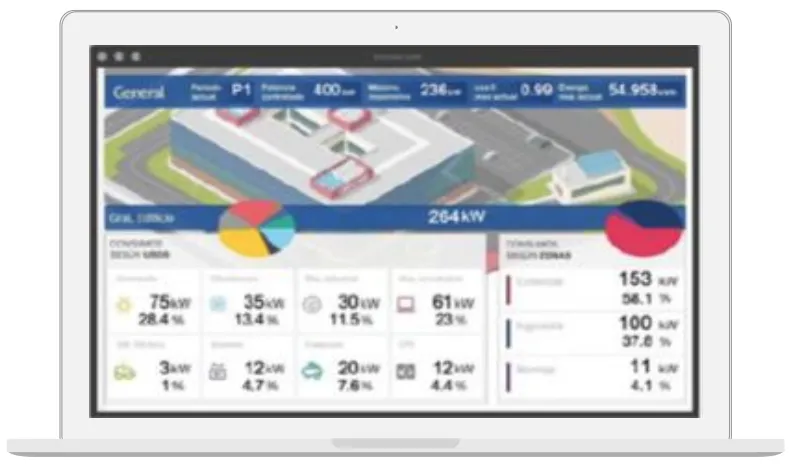
General view
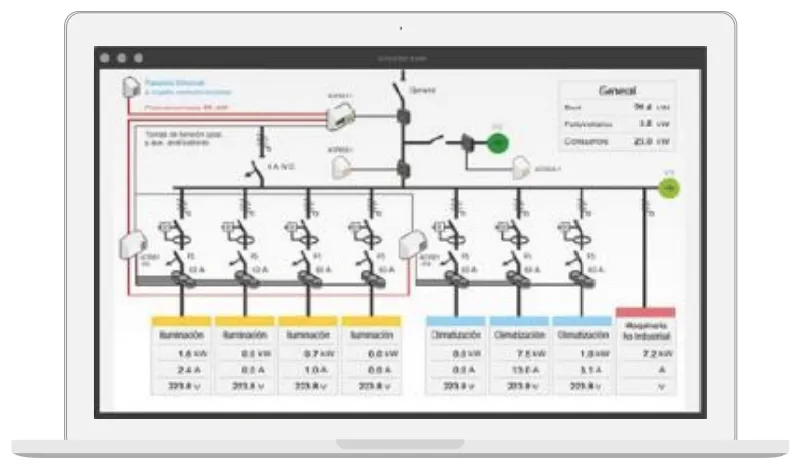
View of consumption by line
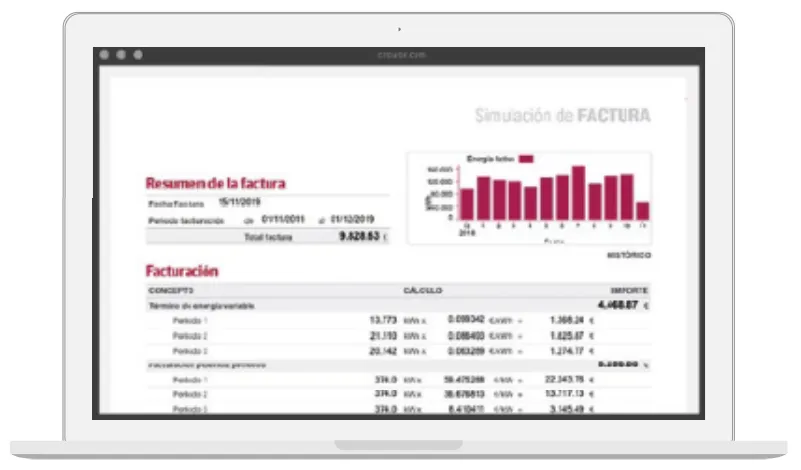
Report of billing for consumption
Highlights of Power Management System’s ECN Automation Solutions

|
Real-time display of device parameters (electrical, process signals, temperatures) |

|
Remote parameterization of devices |

|
Historical record |

|
Graphical and table representation of stored data |

|
XML data export (OPC and SQL with additional modules) |

|
Compatible with any web browser, even on tablets and cell phones |
Plant Utilities Management
One of the main operating costs are the plant utilities:
At the same time, it is where we will find the greatest waste, mainly because its use is distributed in all plant facilities, which makes it difficult to record and control leaks and excess consumption.
By implementing a measurement, recording and control system, savings of up to 20% in the consumption of these energy sources can be achieved.
ECN Automation has designed an energy consumption information system that allows it to keep an accurate record of the distributed use of these fluids in the plant and associate it with production, obtaining key process indicators (KPIs) to generate significant savings.
20%
It is the waste of energy that can be achieved in a plant by not having a distributed record of its consumption and indicators associated with production.
Energy Information System
ECN Automation has developed an information system for the most used energy in the plant: Air - Gas - Water - Steam - Power; that generates KPIs related to production that allows you to manage a savings program.

By implementing the Energy Information System, it is possible to keep production costs controlled according to your cost savings program.
Compressed air
Today the most expensive gas and the most misused.
Natural gas
The main fuel.
Water
The scarcest resource.
Steam
The easiest resource to squander.
Electricity
Main cost of operation.
Energy information system
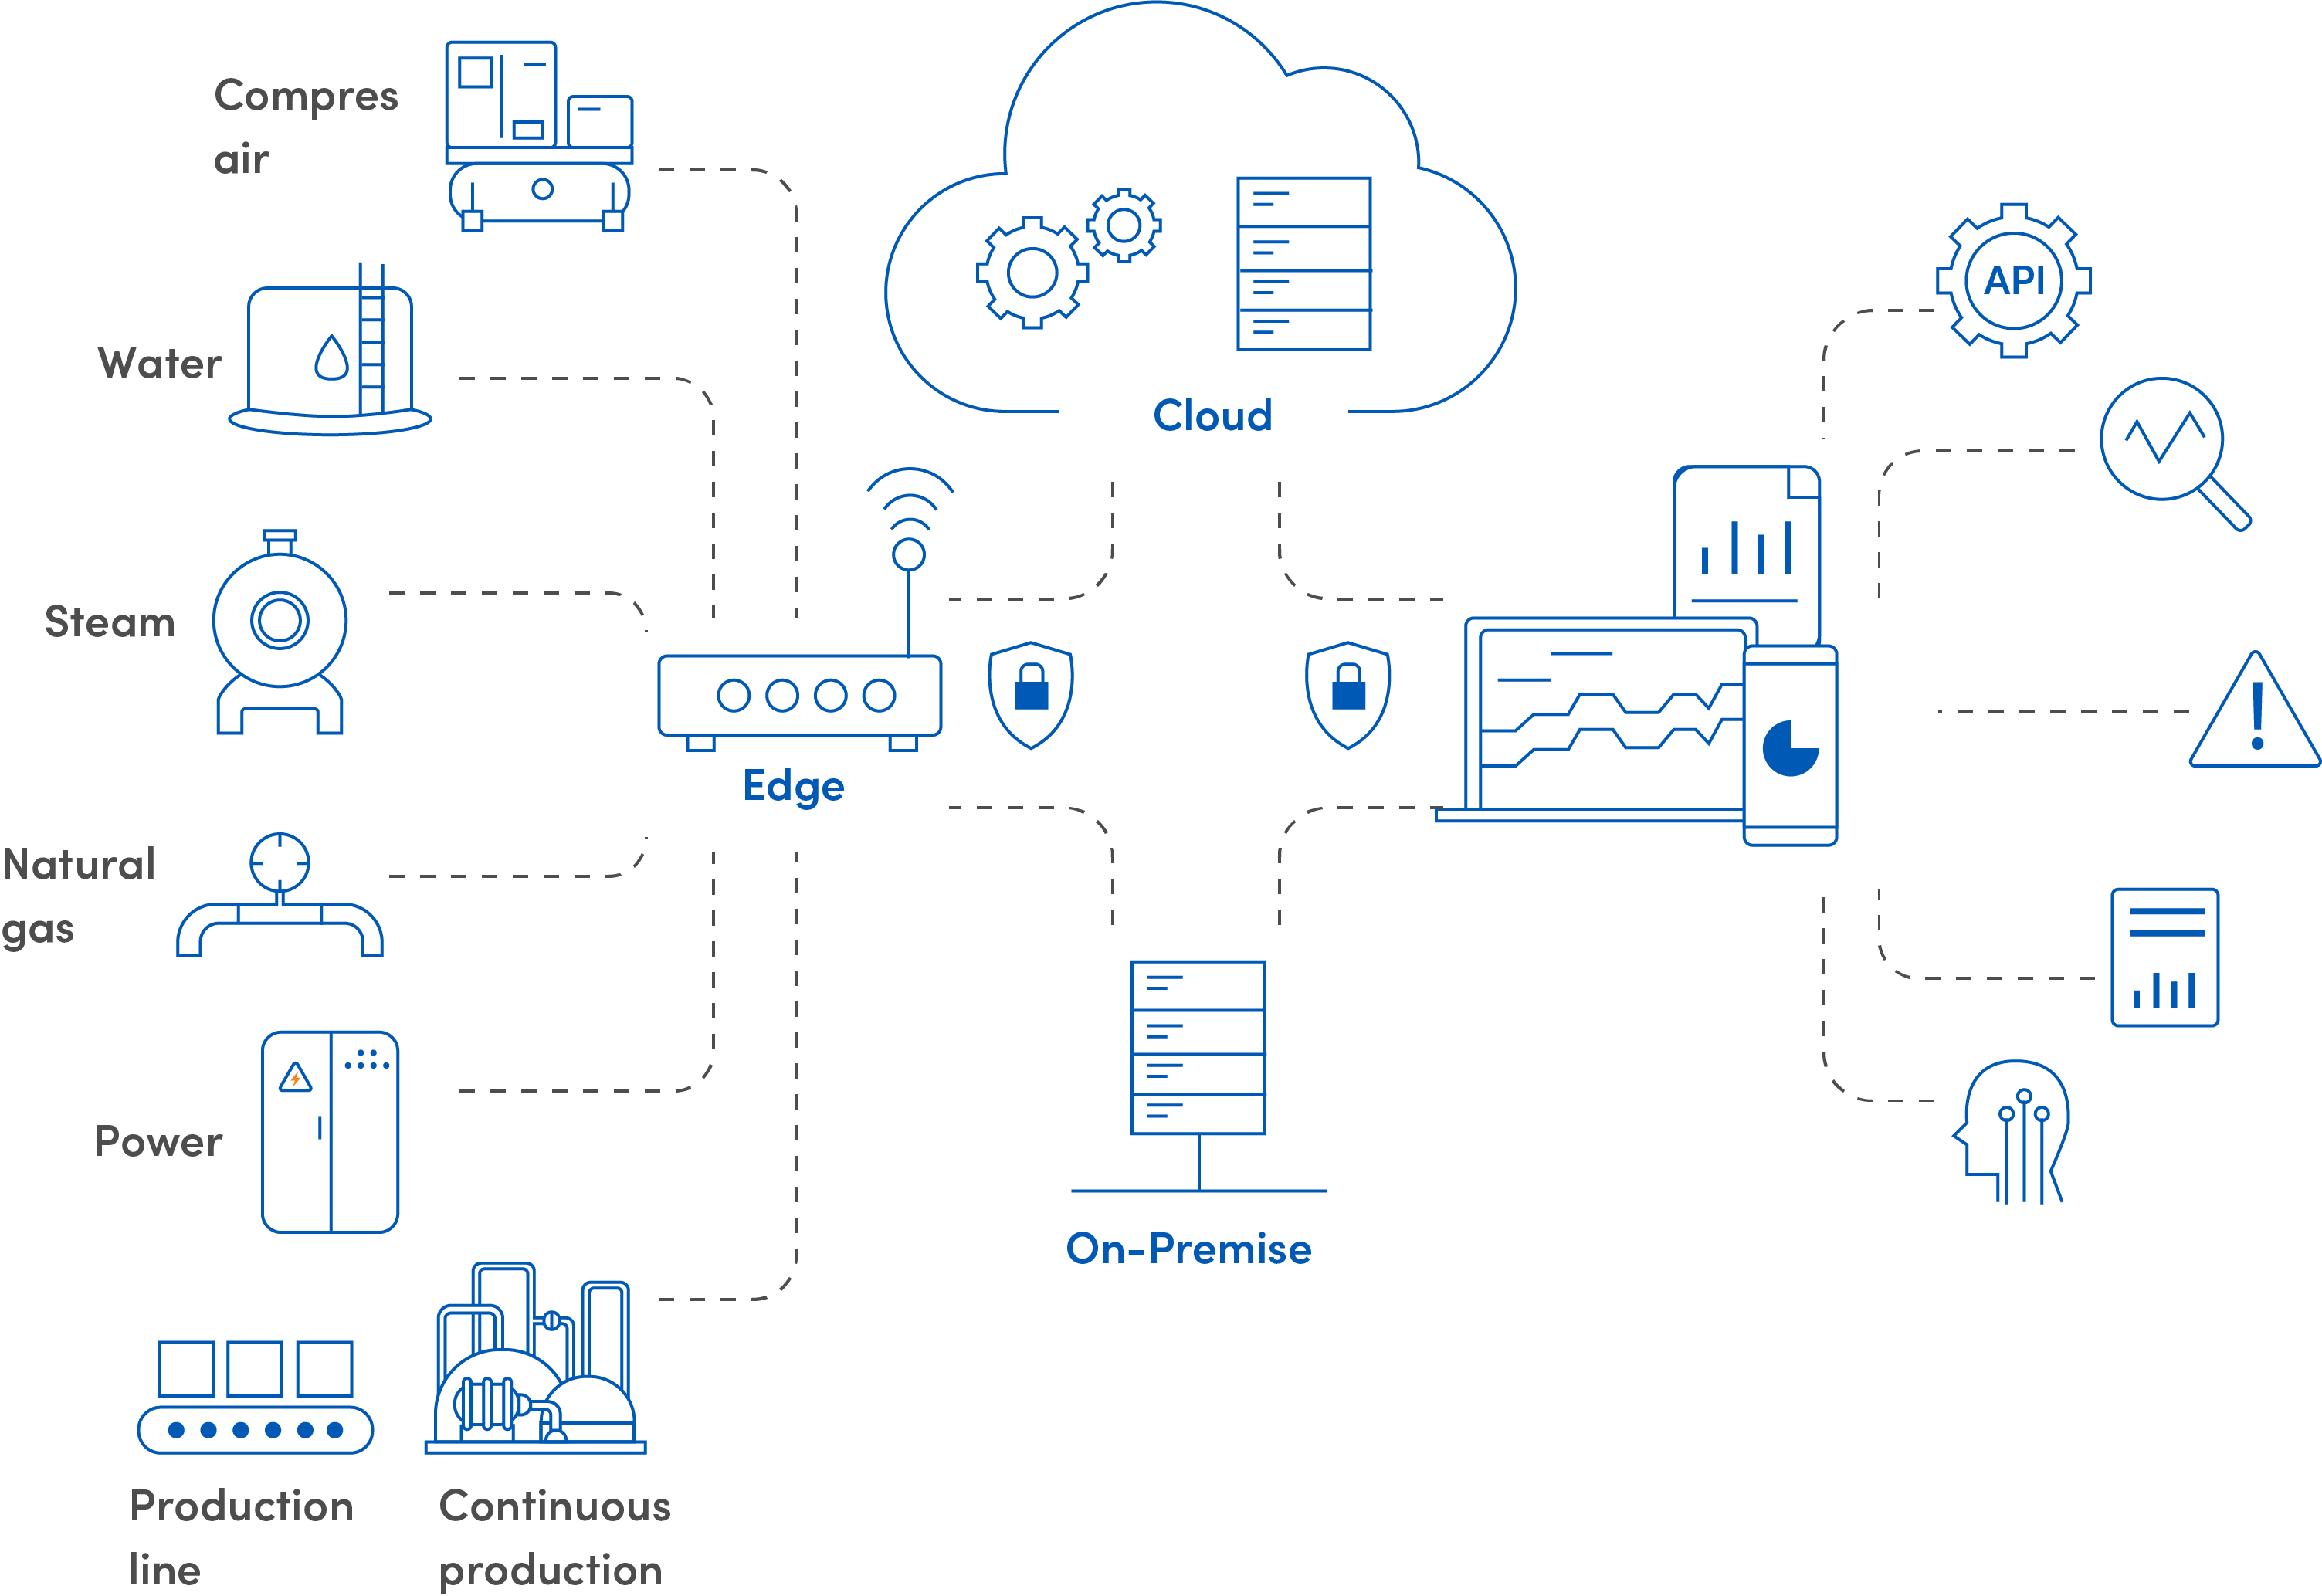
The energy information system collects data from the measurement points distributed in the compressed air, natural gas, water, steam and power plants, which are concentrated in a server either in the cloud or on-premise. The information of the measurement devices is collected from the same existing meters in the current control systems or by IoT locally or remotely.
General system architecture
KPI dashboard
The information collected from the measurement devices is associated with plant production through KPI's key process indicators, in BI Business Intelligence format that has the versatility of associating information tables, graphs, trends, mathematical calculations according to the user's needs and presented on a desktop, laptop, tablet or smartphone.
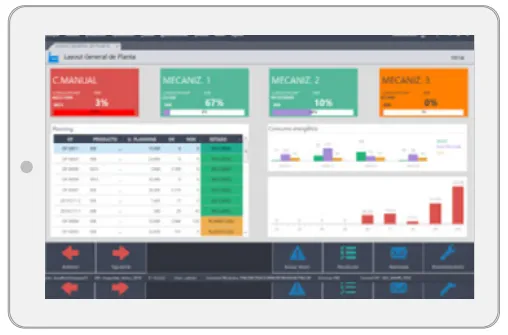
Monitors
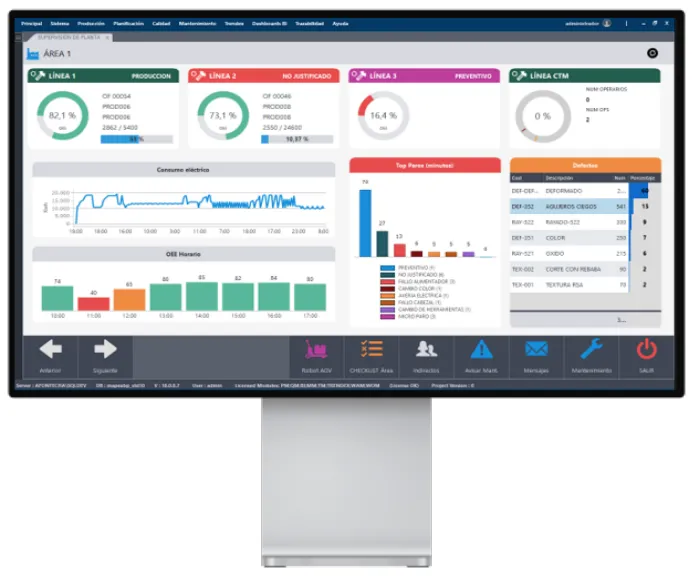
BI screen with energy consumption indicators
Tablets
Consumption trends dashboard
Smartphones
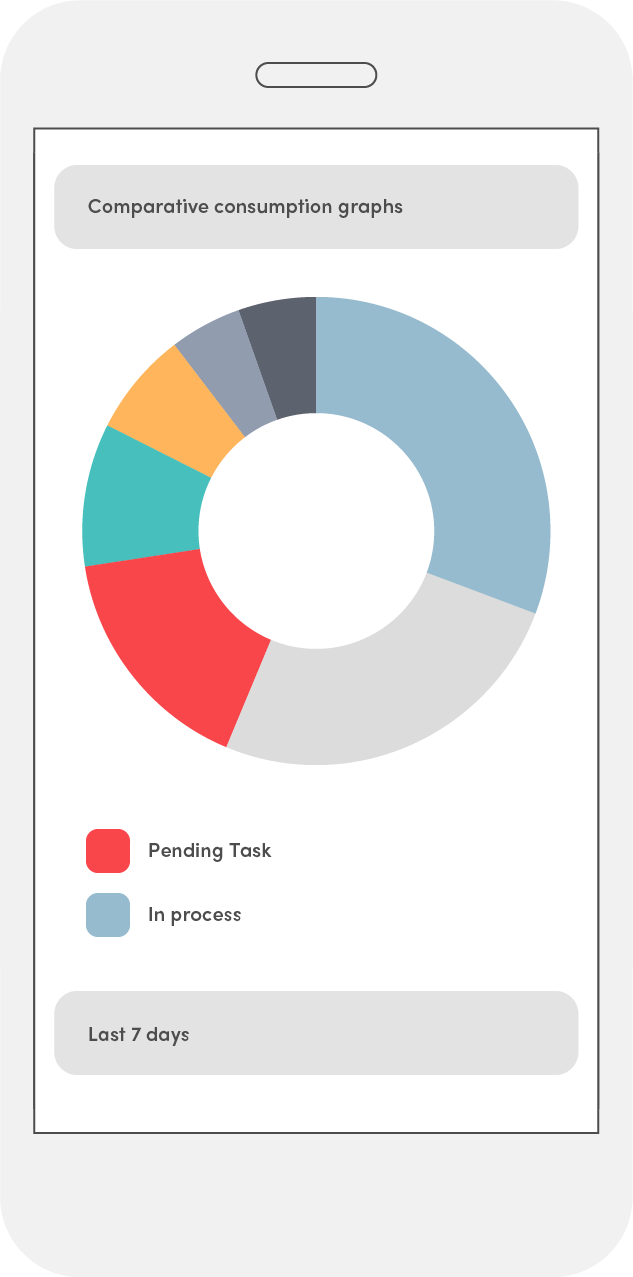
Comparative consumption graphs

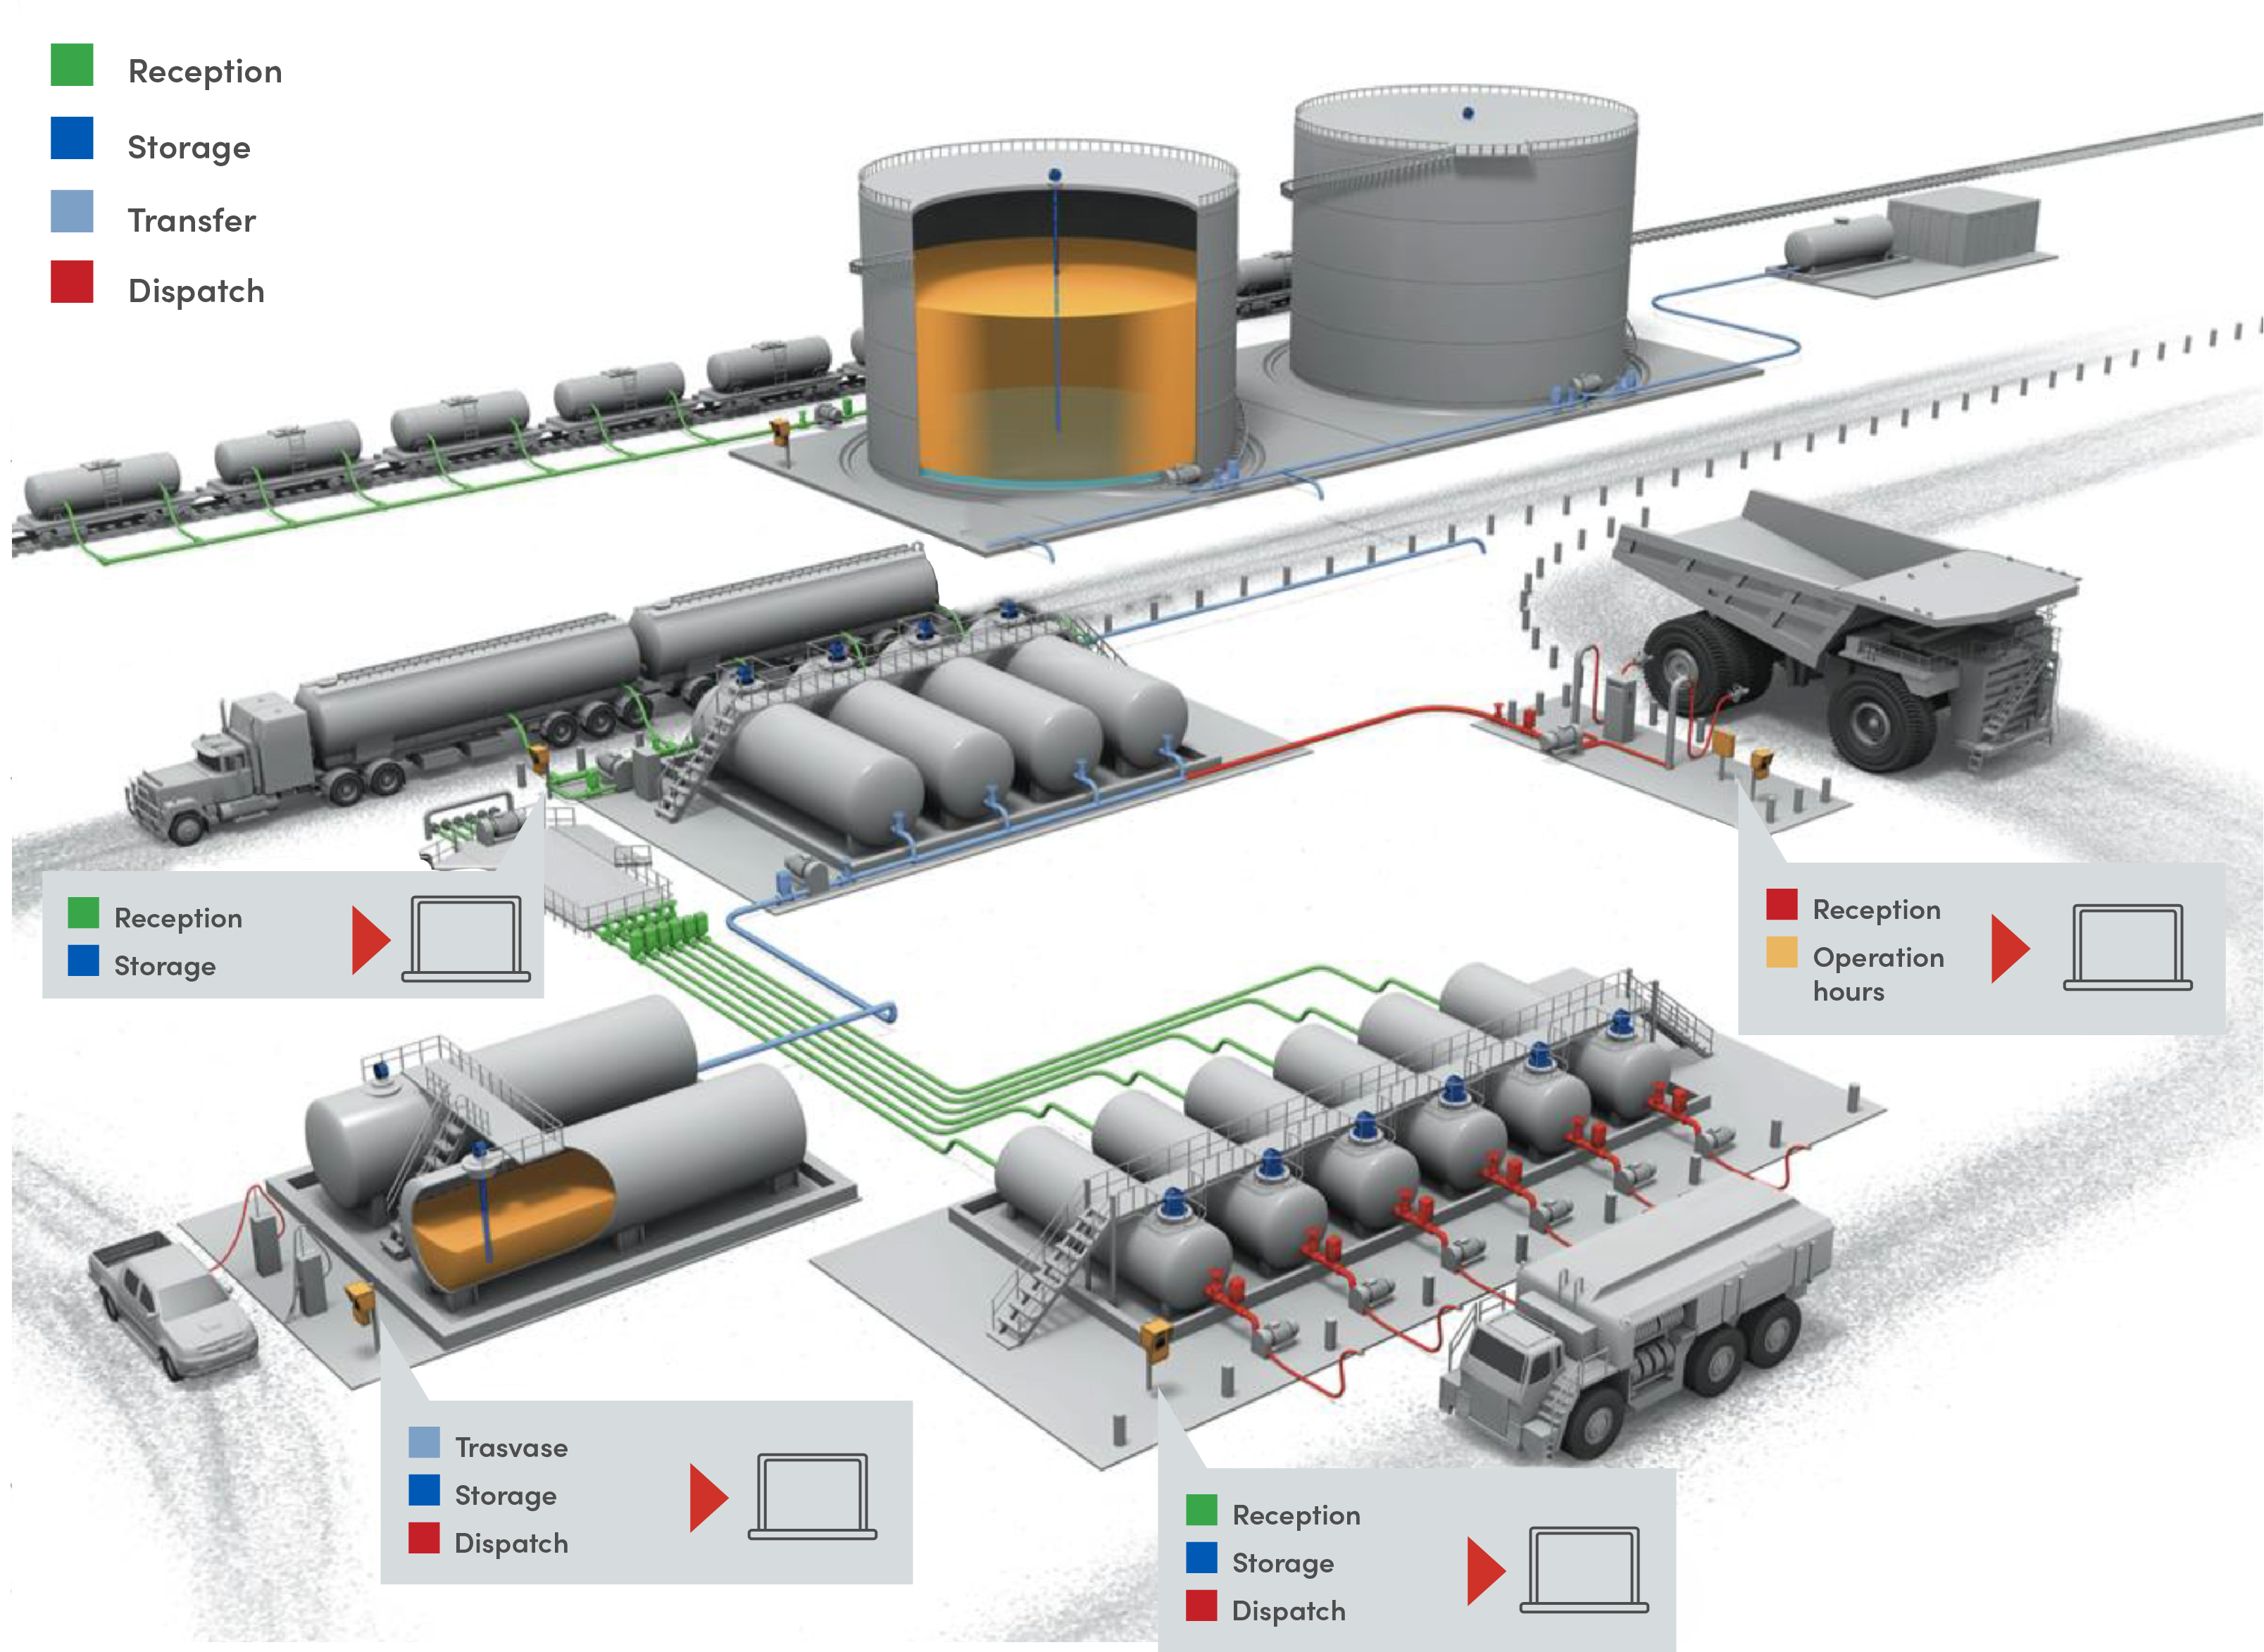
Fuel Distribution Management
Fuel represents up to 30% of the fixed expenses of mining operations, this can be reduced thanks to the correct fuel management. Through the correct instrumentation to achieve fuel reconciliation in its plants, monitoring from the supply chain to gasoline dispatch, multi-operation monitoring for decision making, authorizations in an agile way, integration to its applications such as ERP, SAP. Customized reports according to the variables that are required. Information traceability with the correct network infrastructure.
The solution covers the entire supply chain: terminals, distribution, transportation, deliveries, supply, transfers, fuel quality analysis and data analytics. The product has been specifically designed for the environmental conditions and requirements of the mining industry.
Successful case
With our help, one mine saved $ 2M in capital in just six months.
The problem:
For one of our customers, the lack of timely and accurate knowledge of his fuel consumption was forcing him to order more fuel than he actually needed. The customer did not have timely or accurate data on their fuel consumption levels, their stock, or deliveries and, therefore, there was no way to determine exactly how much fuel inventory to keep on site. They were constantly overbuying and storing more than necessary, in order to avoid running out of fuel to operate.

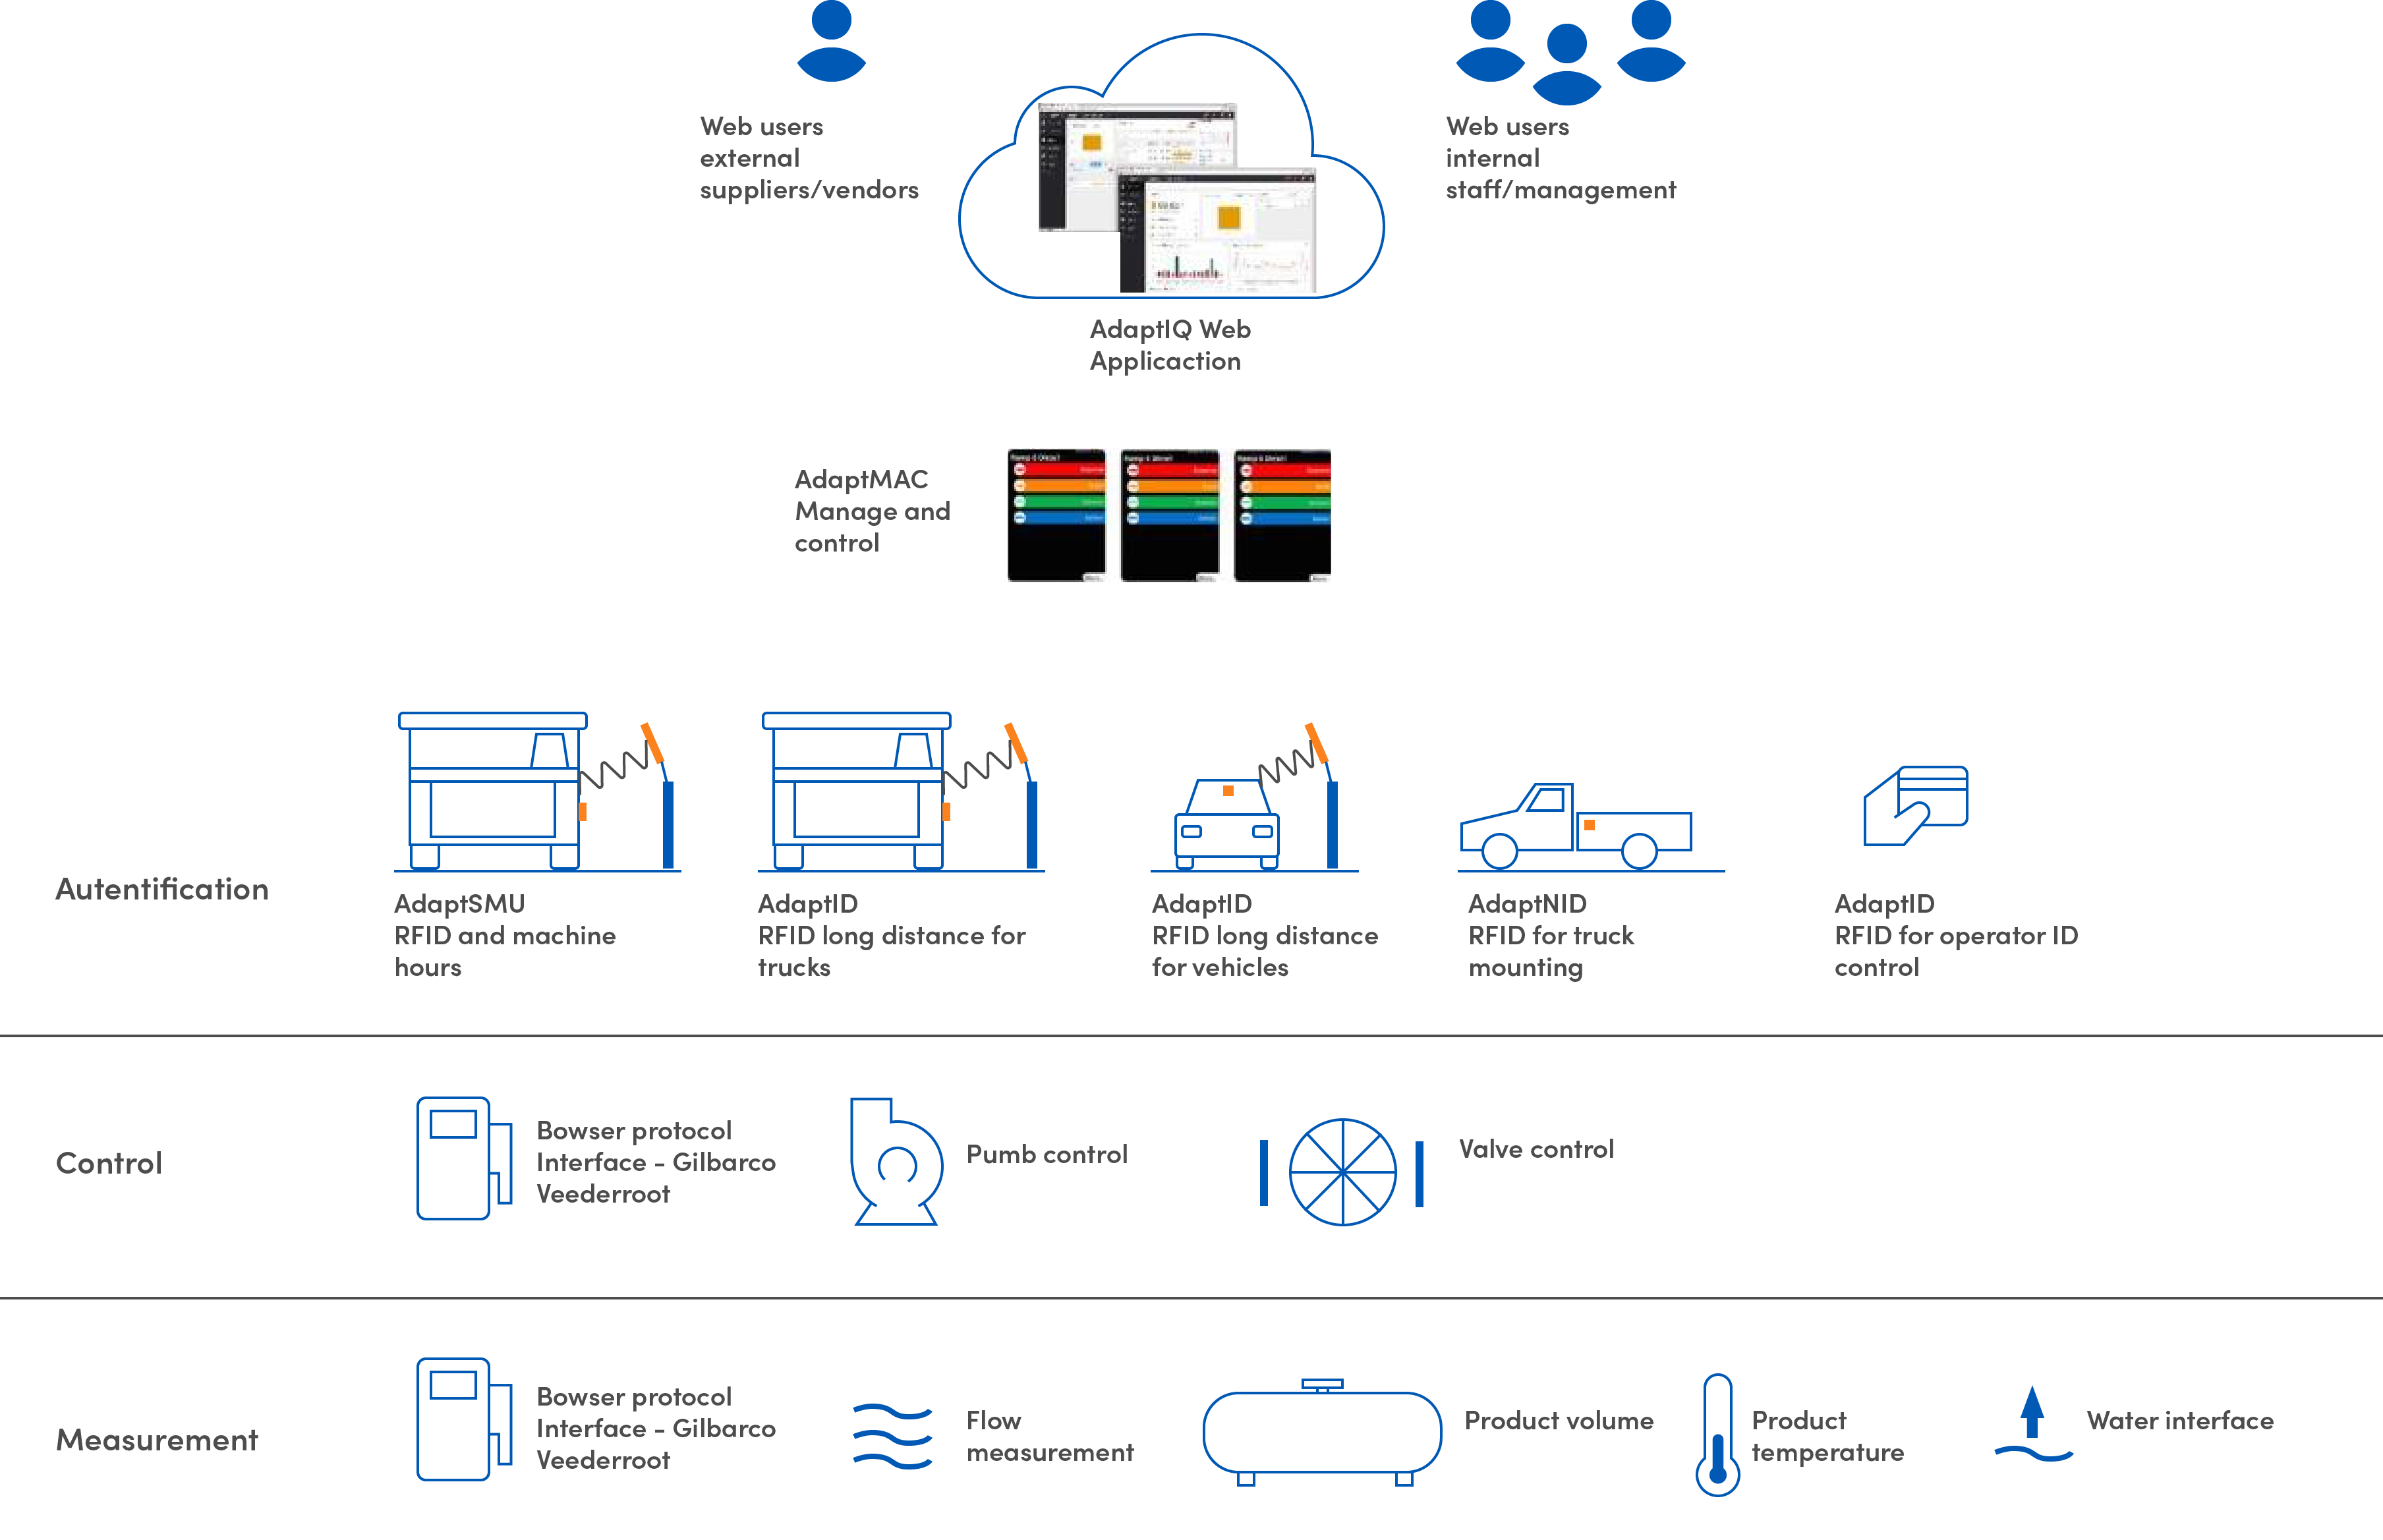
Architecture

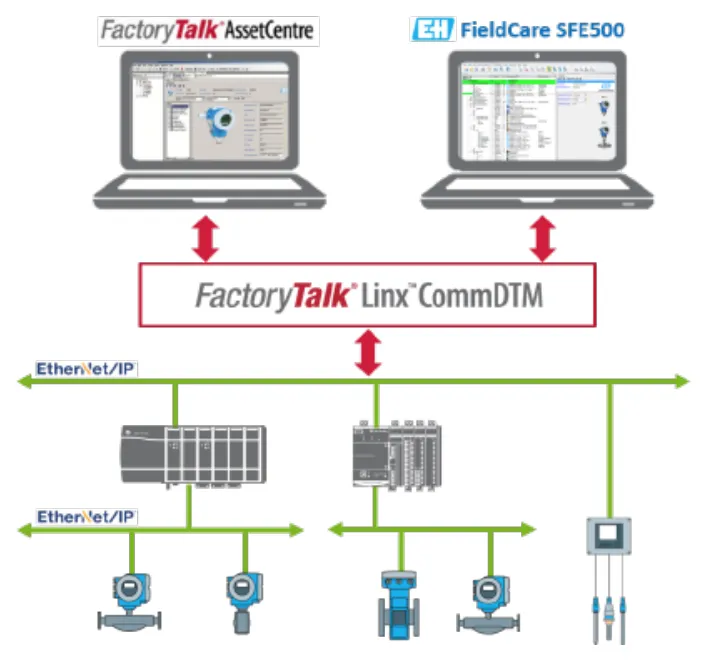
Asset Management
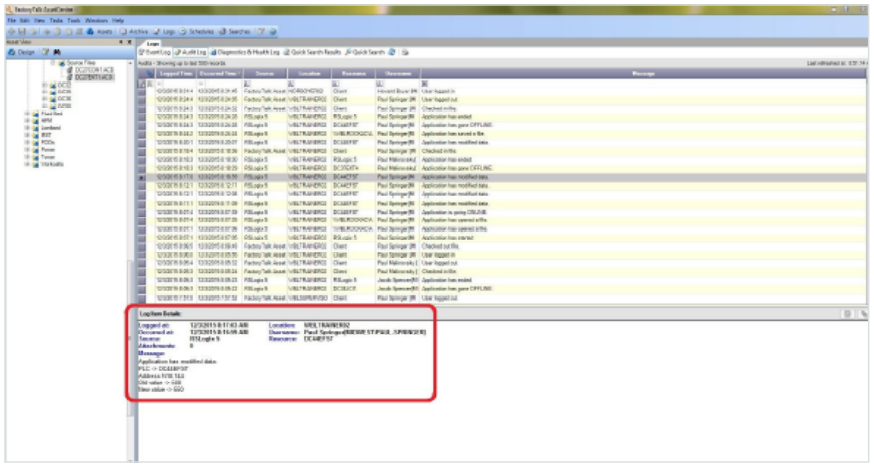
This Asset Centre-based solution from Rockwell Automation allows you to create a model of your plant including all the assets that need to be monitored, such as instrumentation, PLCs, panels, operating stations. Through dashboards the condition of the equipment is shown in real time to allow timely and informed decision making. In the same way, the information collected is stored to allow the historical analysis of the behavior of the assets.
Benefits
Characteristics
Features
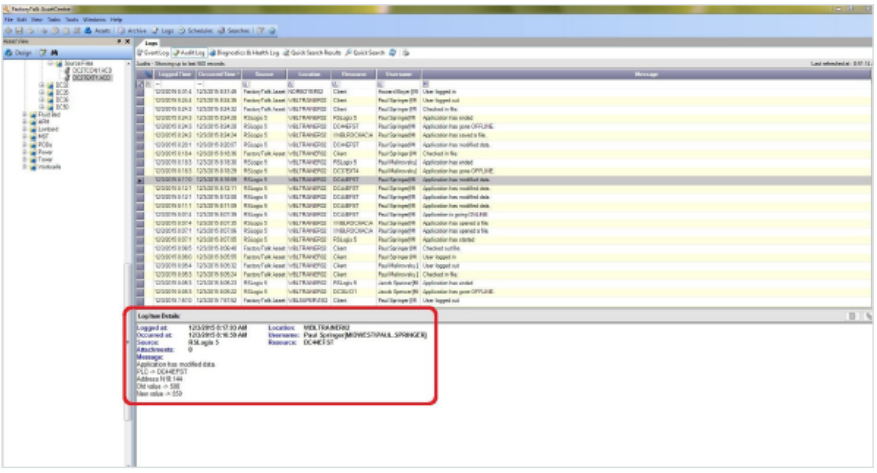
Registration by event
It allows to keep a record of all the activity in the control system (Software downloads, user logging, etc.).
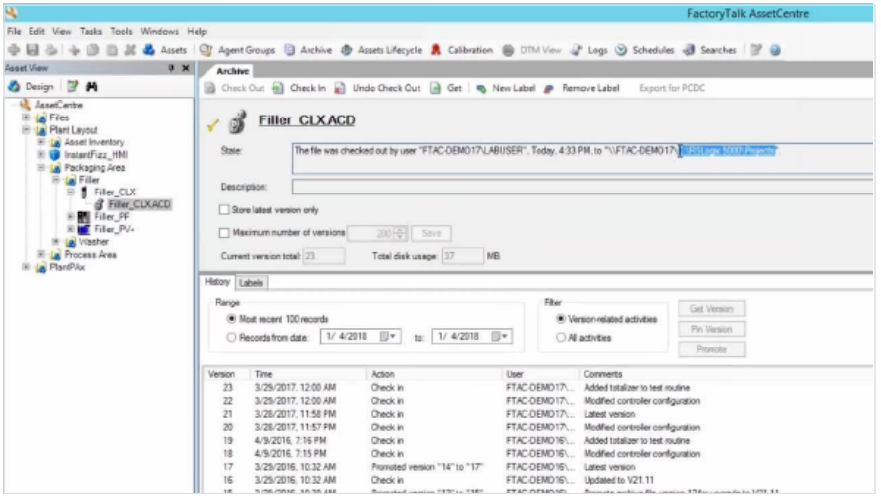
Version management
It allows to keep control of the versions of the programs of each PLC.
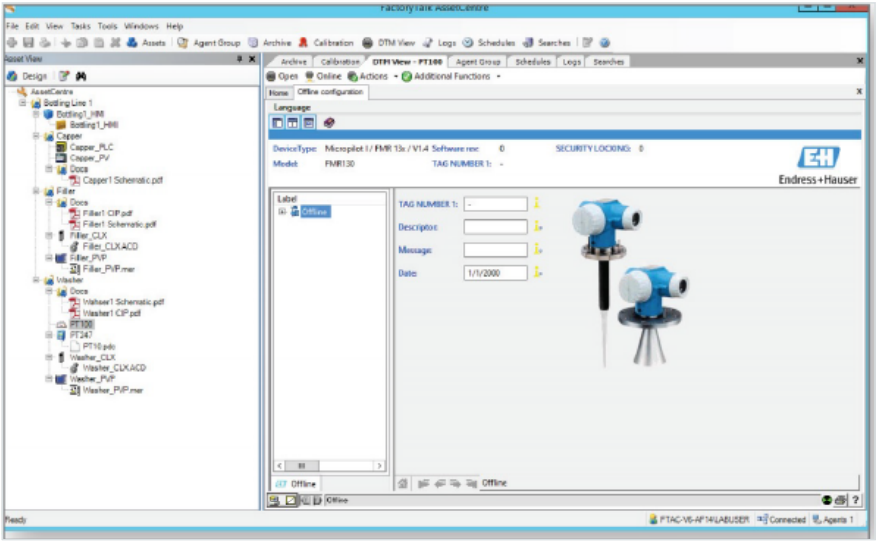
Instrument management
It allows organizing the information on the parameterization of the instruments, in the same way it is possible to calibrate them.
Reports
It allows to generate reports of system activity.
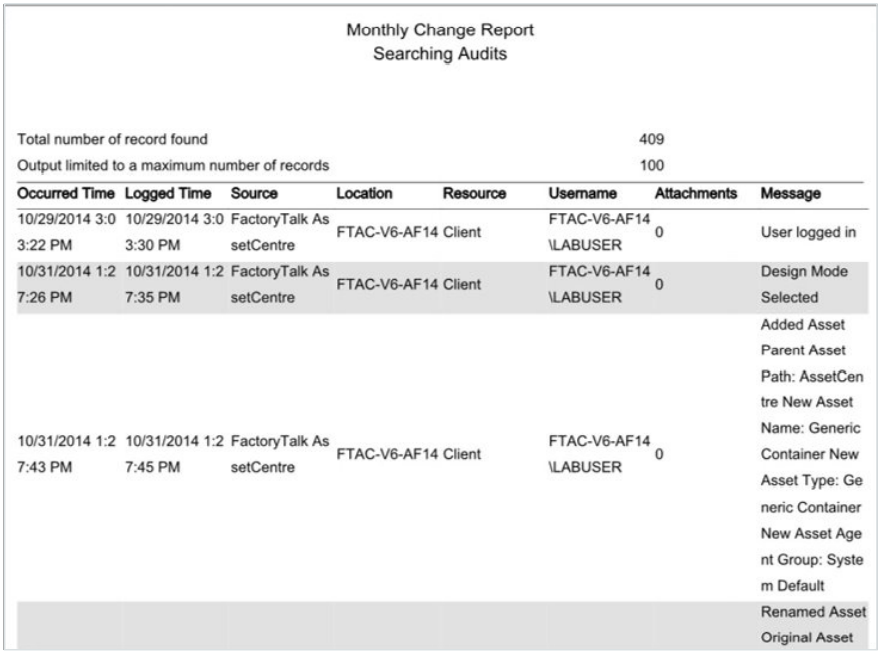
Audit
It facilitates the task of audits for the control system, showing information about the events that have occurred.